


Preview
Creation Date
2020-09-14
Description
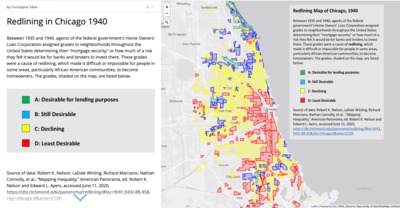
Christopher Silber made this interactive map in Geo 347: Web GIS, showing redlining in Chicago between 1935 and 1940. Redlining practices declared entire neighborhoods risks for mortgages, codifying racial discrimination in banking and making difficult or impossible for entire neighborhoods of African Americans to be able to become homeowners or maintain and upgrade properties. In making this interactive map, Christopher Silber not only analyzed and mapped the data and brought it into an interactive map, he also created custom javascript code to adjust a ESRI StoryMaps template and hosted it on his own website. The interactive map in it’s entirety is mirrored at the following link: https://depaul-edu.maps.arcgis.com/apps/MapJournal/index.html?appid=04efec7203ac4243b09c9d2bcddb02e5
Keywords
Redlining, Chicago, housing, racism, interactive maps, GIS