


Preview
Creation Date
2016-02-29
Description
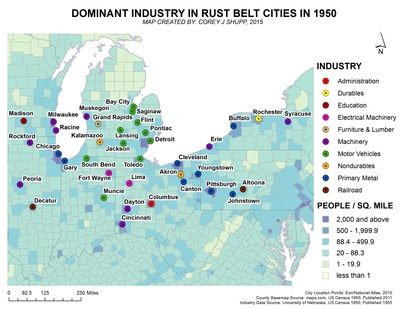
Corey J Shupp devised this map in GEO 241-GIS in Fall 2015. His goal was to discover the historically dominant industries in American cities and synthesize his findings into a map. Before international trade and economic globalization developed over the last 50 years, it was widely known as common sense that certain industries defined many American cities, for example, Detroit as “The Motor City”. Corey studied the industrial revolution and the economic effects of World War Two, to learn the dominant industries in the “rust belt” or “manufacturing belt” in the 1950s, the peak of American industry.
This map, specifically, shows the single most dominant industries, based on the 1950 US Census, in 37 of the most prominent “Rust Belt” cities. While each city represented in the map might consist of more or less defined employment ratios (using Detroit as an example, as its employment ratio heavily favors the Motor Vehicle Industry), the results displayed on the map represent the industry that took the highest percentage of the cities’ employment. Ten distinct industries were found to define the 37 cities researched, while some industries were more prevalent among the cities than others.
To provide meaningful context and comparison, the dominant industry unique value map was combined with a graduated color county population density base-map, derived from the same year, 1950. The maps were also combined with spatial data to locate and display the 37 prominent cities researched.
The collaboration of research synthesized creates a map which can identify the dominant industries that once defined these prominent American cities and even regions.
Keywords
rust, rust belt, industry, pollution, midwest, population, 1950