


Preview
Creation Date
2014-03-05
Description
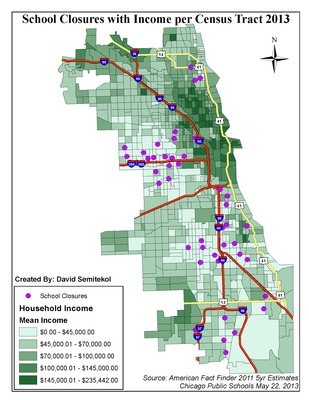
In the wake of CPS announcing that it was closing fifty schools, in Spring 2013 Department of Geography students examined characteristics of the neighborhoods impacted as part of their course work in GEO 344. The students were able to investigate this controversial issue using Geographic Information Systems (GIS) that provides tools for data management, mapping, and spatial analysis. The “School Closures with Income per Census Tract” map shows that those schools are spatially clustered in communities west and south of Loop, and are overrepresented in low income neighborhoods. The “Average School Performance” map indicates that the closing schools are largely located in moderately performing communities, the darker shades representing lower performance. In the Department of Geography, GIS both gets students engaged in important community issues, and enhances analytical capabilities based on empirical data.
Keywords
GIS, Geography, Chicago Public Schools, School Closures