


Preview
Creation Date
2019-11-01
Description
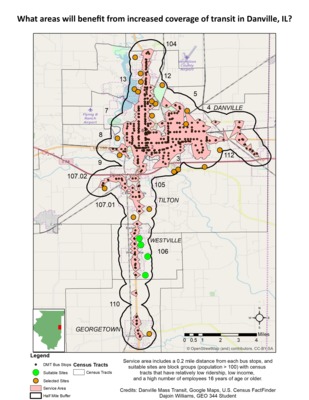
Dajoin Williams created this map in Spring Quarter 2019 in GIS III: Spatial Analysis for Sustainability. This map shows the 0.2 mile service area around the bus stops in pink, and block groups that might most benefit from increased coverage of the service area. The service area is constrained to a roadway network. We first selected block groups, shown as brown dots, that had more than 100 in population and were located outside of the 0.2 mile service area and within the 0.5 mile buffer of bus stops. From these, we selected suitable block groups, shown as green dots, that were classified as having low income, low transit ridership, and high number of workers. Suitable sites are concentrated in census tract 106, east of Westville in Vermilion County. This methodology might be used for transit studies to promote ridership in areas where it is most needed.
Keywords
Network Analysis, Transit, Urban Planning