


Preview
Creation Date
2017-08-31
Description
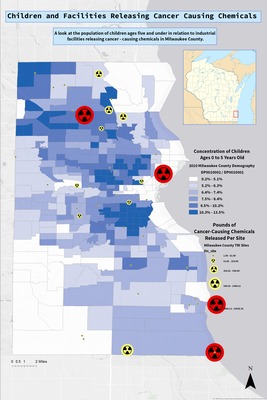
This map by Michael Rasmussen was created in Geographic Information Systems I: Digital Mapping (GEO 141) in Spring of 2017. The map displays TRI (Toxic Release Inventory) facilities releasing cancer causing chemicals in relation to the distribution of children under 5 years old in Milwaukee County, Wisconsin. Carcinogenic chemicals monitored using EPA data from 2015 include, but are not limited to, lead, arsenic, chromium, nickel, and other related compounds. The census data provides a gradient showing the density children under the age of 5 ranging from 0 to 13.5%. Additionally, the toxic symbols used to represent each of the 42 facilities vary in size to symbolize the amounts of chemical release per site, while red is used to differentiate the top 3 polluters and show the magnitude of their emissions. Michael Rasmussen’s goal was to create an eye catching and easy to read map that shows the relationship between toxic chemicals, and one of the most vulnerable groups of people in the country.
Keywords
cancer, toxic, industrial, children, milwaukee, wisconsin