


Preview
Creation Date
2014-11-03
Description
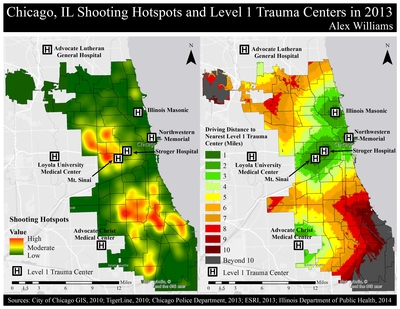
Alex Williams created this map in GEO 344 - GIS III to compare the areas of the city of Chicago with the highest densities of shootings to relative driving distances to the nearest Level 1 trauma center. Using publicly available Chicago Police Department crime data for the year 2013, a density map was created to identify shooting hotspots throughout the city. A map showing relative driving distances to the nearest Level 1 trauma center was also created as a means of identifying areas of the city most underserved by such facilities. Examined in the context of one another, these maps show that the areas of Chicago currently experiencing near epidemic levels of gun violence are also often the areas with the most limited access to the highest level of emergency care.
Keywords
crime, public health, hospitals, violence, guns, Chicago